Questions and discussion for this lecture live here. Hit Reply below to ask a question.
Could we plot the error as range as two parallel lines to the perfect line with an offset normal to the perfect line of +/- the error value?
1 Like
Hi Olivia,
Thanks for your post. I think I follow the question. Putting the plot your are mentioning here for reference
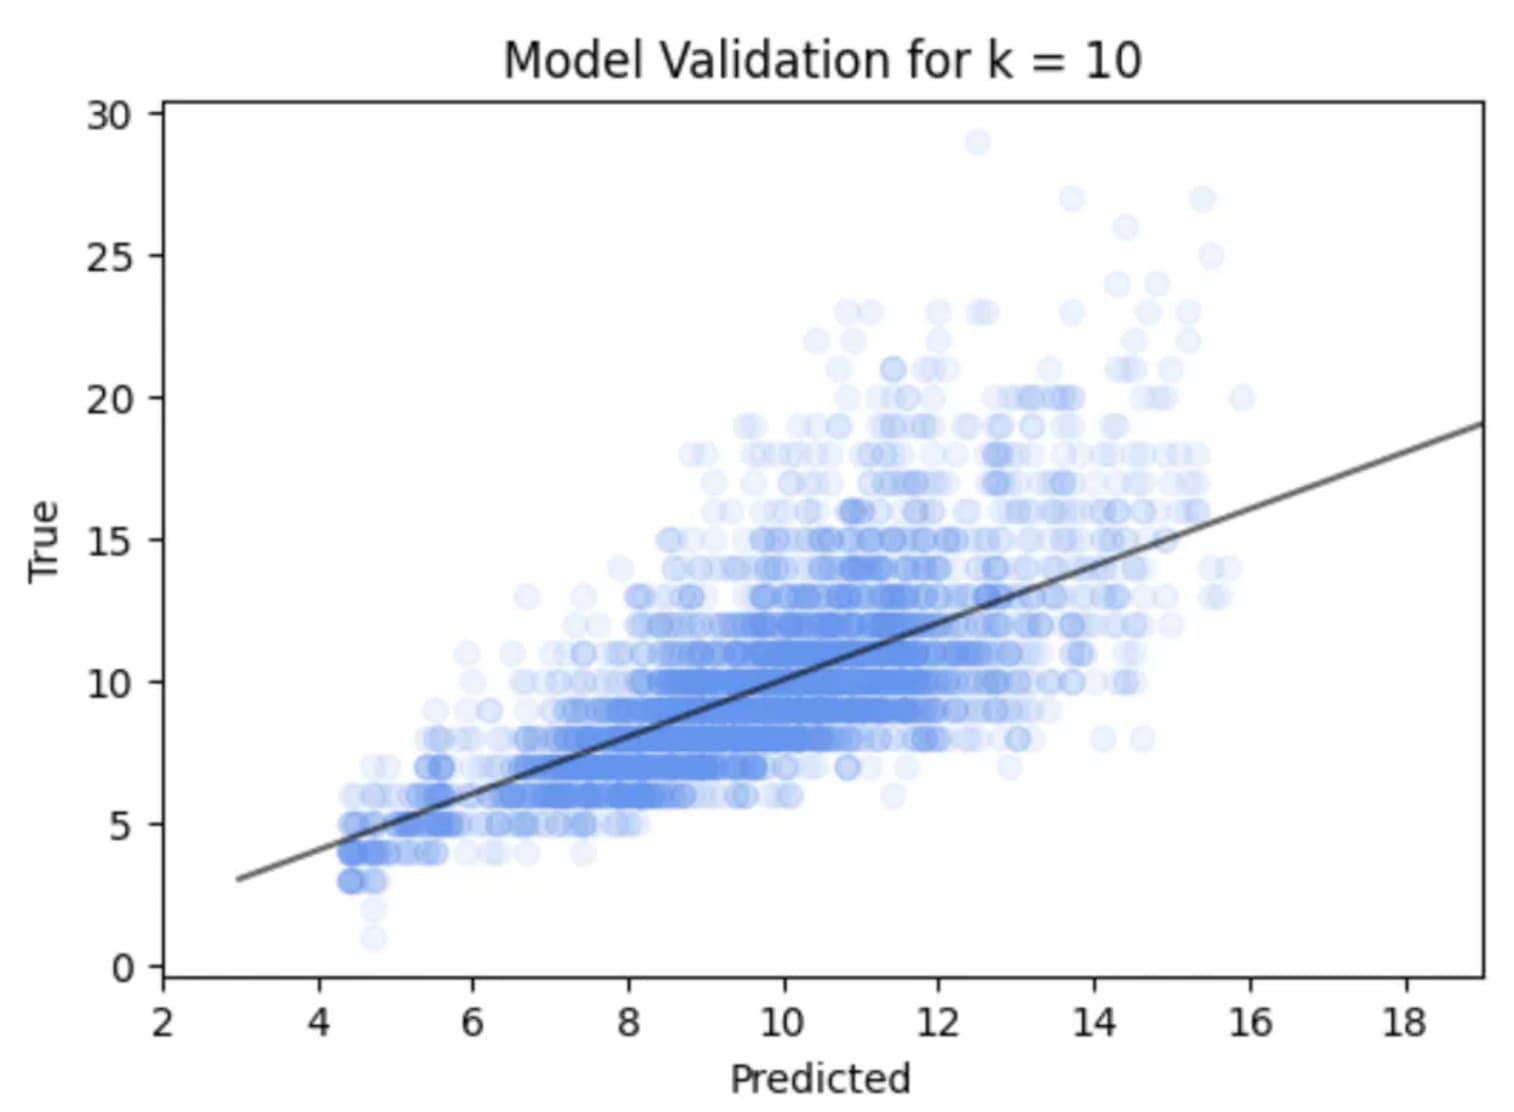
So in the plot where we show predicted vs true over the test data for kNN. We see the error is quite a complex spread (or distribution) away from the perfect line. In particular for this example the error seems to increase with snail age / number of rings.
I think you could do as you suggest as a way of summarising the error, but you might loose some of the fine scale information. So possibilities along the lines of your suggestion
-
You could calculate the average error above the line and below the line of the points, and draw parallel lines to indicate the average over and under estimate. The advantage of this is it would give you simple summary statistics of how you model does, and how the performance is bias to over or under estimate.
-
You could do something more complex and present / draw percentiles (https://en.wikipedia.org/wiki/Percentile) this would take alot more effort, but would allow you to give you confidence bounds on the accuracy with associate estimations of the probabilities of get various errors.
-
Since the true output are actually whole numbers, you could plot a violin plot for each of the true labels giving the distribution of error of the predictions - for more information look at matplotlib documentation here https://matplotlib.org/stable/gallery/statistics/violinplot.html
Hope this helps. Let me know if I haven’t understood your question. If any of the above are interested, I’m sure we could spin up a bit of code to do those as different ways to present your results.
Best
Tim
1 Like
Thanks for the detailed reply Tim - that’s great.
Indeed, I think 1. is what I had in mind, but as you say - this would also have highlighted how the average error by itself is probably not a good way of judging accuracy of the model in absolute terms. I think 2. would be very useful in a table format as a general model check?
Thanks for highlighting violinplot - I’ll give it a try.
1 Like
Hi Tim - just found a typo in the notes I think?
X_train, X_test, y_train, y_test = train_test_split(X_scaled, y, train_size=0.2, random_state=42)
should be
X_train, X_test, y_train, y_test = train_test_split(X_scaled, y, test_size=0.2, random_state=42)
1 Like
Hi Olivia,
Great spot. As you highly that you probably want a test set smaller than your training set! Code will still work. But my example would have been trying to use 20% of the samples for testing, as your code achieves.
Thanks for spotting! Keeping you on your toes!
Best
Tim
1 Like
Hi Olivia and Tim,
Showing the rms error lines is interesting and could be helpful (although the displayed points showing more information). However, a small point: surely the lines should be displaced along the predicted axis, rather than normal to the perfect line, as they are errors in the prediction.
I’ve been playing around with the code, so it differs a bit, but produced this plot (at the optimal k):
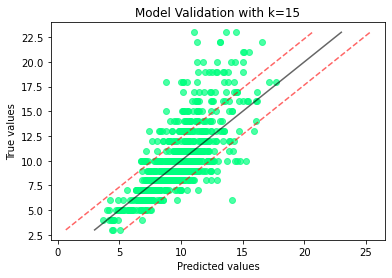
Is that what you had in mind?
3 Likes
Thank you for sharing your thoughts Olivia, Tim and great plot John! I am learning loads by just reading through the thread.
Something I started experimenting with is changing the split between the train / test data from 80% / 20% to 75% / 25% and this reduced the Root Mean Squared Error to 2.225. Although the optimal k value increased to 28 which could potentially be underfitting.
My question as a beginner to machine learning techniques is how would you choose the ratio between the training / test dataset and what is the common split to choose?
1 Like
Nice, plot to demo what Olivia suggested. As you see, it gives you an “average” view of spread away from good.
What we see in the data is that the model tends to underestimate when the “true” age gets older. This average view misses this information.
2 Likes
Really nice question!
What you want is for the test set to be representative of the population of possible samples. That way it gives you a fair test. So the number of test samples depends on the problem and how much data you have available.
I cover it later in the course, but the more common test method is using a k-fold cross validation.
There is the sklearn documentation for this here - https://scikit-learn.org/stable/modules/cross_validation.html
What this does is split your data into parts, let us say 5 (you can choose). It then builds 5 models. In each model one of the data parts is held out for testing, and the remaining 4 parts are used for training. We then get 5 validation errors. By looking at how much the validation error varies, tells us how representative that size test set is.
Note on me to add a 5-minute explainer on this! I’ll do it in this example.
2 Likes
Thanks for explaining and sharing the link Tim and all understood! My background is climate modelling, so I can see some similarities in techniques there.
Looking forward to the rest of the course.
1 Like
Presumably we should not be surprised that the predicted age underestimates the true age at older ages, as this is using size and weight to estimate age. For any animal, we’d expect size and weight to be a useful guide to age for younger individuals, but much less useful for “fully grown” individuals (even if some of us have “filled out” in recent years!).
Hi John,
This is a really interesting point. I had to think about it. On the face of it yes, sure once you have validated it then train with more data. More data is better right?
I guess the answer is yes. But if including the testing data in the training made a big difference, then I would be really worried. Not only would I be worried that my original test wasn’t fair, I would be worried about the sensitivity of my model in including a small percentage more of my data.
If the latter was the case, I would be doing more investigation anyway. In a way this is what the k-fold cross-validation seeks to address!
Hope this helps, great question! Keep them coming!
Tim
Thanks, Tim. But the way, I presume that this is answering my question in the discussion on module/chapter/… 12 on Exploring whether models are any good, (about additional training on test data, once testing is complete) rather than the point above.
Yes - I will post it there for others. Sorry I didn’t pick the other question up! Keep them coming.
Thanks, Tim. And no problem: in the point about underestimating older ages, I was just trying to relate this behaviour to the subject domain (the “real world”!), about might be causing it and what it might mean.